Trends Over the Past Decade
Today’s market trends are mirroring the market that we experienced in 2015/2016 – the Fall of 2015 exploded in rapid price growth primarily in detached houses which tapered off mid 2016 and was followed by huge increases in the attached market. I thought these graphs were a great visual representation of how the market is performing, and indicators such as these are definitely pointing to a busy spring market for 2021 driven primarily by a lack of inventory, low interest rates, and demand for more space. With our finite building areas, we are definitely impacted by our limited ability to add more detached homes in a fashion that can keep up with demand. Increased building activity for apartments, townhouses, and duplexes definitely helps, but in many markets is still unable to keep up with demand.
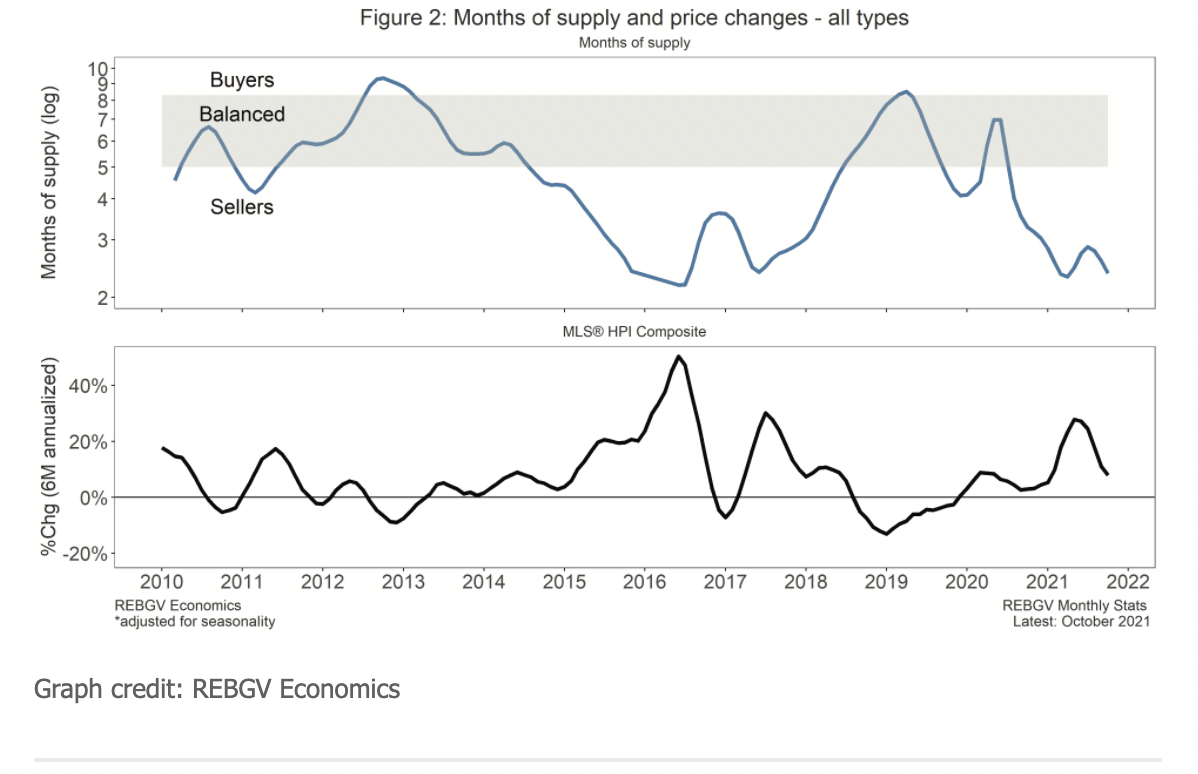
Below you can see the strong relationship between months of inventory and price growth.
Home prices tend to rise when months of inventory is below five (sellers’ market), fall when months of inventory rises above eight, and tends to stay roughly flat in between.
Home sales activity remains up, listings down across Metro Vancouver’s housing market
As we near the end of 2021, home buyer demand remains well in excess of long-term averages and the supply of homes for sale continues to decline across Metro Vancouver’s housing market.
The Real Estate Board of Greater Vancouver (REBGV) reports that residential home sales in the region totalled 3,428 in November 2021, an 11.9 per cent increase from the 3,064 sales recorded in November 2020, and a 1.9 per cent decrease from the 3,494 homes sold in October 2021.
Last month’s sales were 33.6 per cent above the 10-year November sales average.
“We expect home sale totals to end the year at or near an all-time record in our region,” Keith Stewart, REBGV economist said. “We’ve had elevated home sale activity throughout 2021 despite persistently low levels of homes available for sale. With a new year around the corner, it’s critical that this supply crunch remains the focus for addressing the housing affordability challenges in our region.”
There were 3,964 detached, attached and apartment properties newly listed for sale on the Multiple Listing Service® (MLS®) in Metro Vancouver in November 2021. This represents a 2.6 per cent decrease compared to the 4,068 homes listed in November 2020 and a 2.1 per cent decrease compared to October 2021 when 4,049 homes were listed.
The total number of homes currently listed for sale on the MLS® system in Metro Vancouver is 7,144, a 35.7 per cent decrease compared to November 2020 (11,118) and a 11.1 per cent decrease compared to October 2021 (8,034).
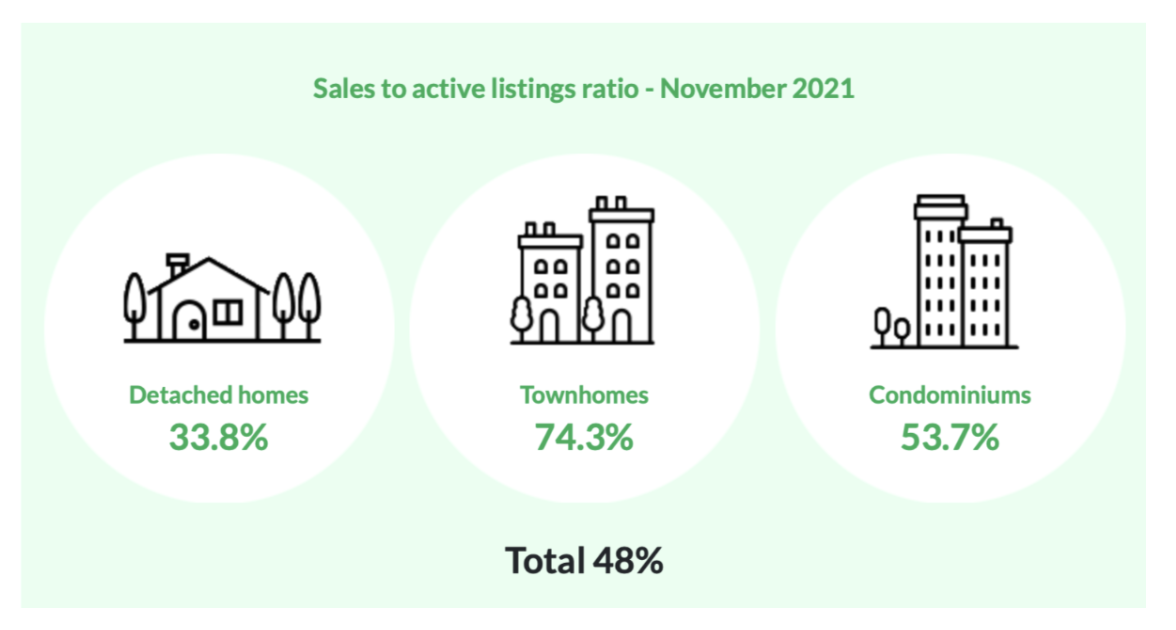
For all property types, the sales-to-active listings ratio for November 2021 is 48 per cent. By property type, the ratio is 33.8 per cent for detached homes, 74.3 per cent for townhomes, and 53.7 per cent for apartments.
Generally, analysts say downward pressure on home prices occurs when the ratio dips below 12 per cent for a sustained period, while home prices often experience upward pressure when it surpasses 20 per cent over several months.
“The imbalance between supply and demand, coupled with some buyers wanting to use rate holds on lower rate fixed-term mortgages, is keeping upward pressure on home prices in this traditionally quieter time of year for the market,” Stewart said.
Credit: REBGV
Recent Comments